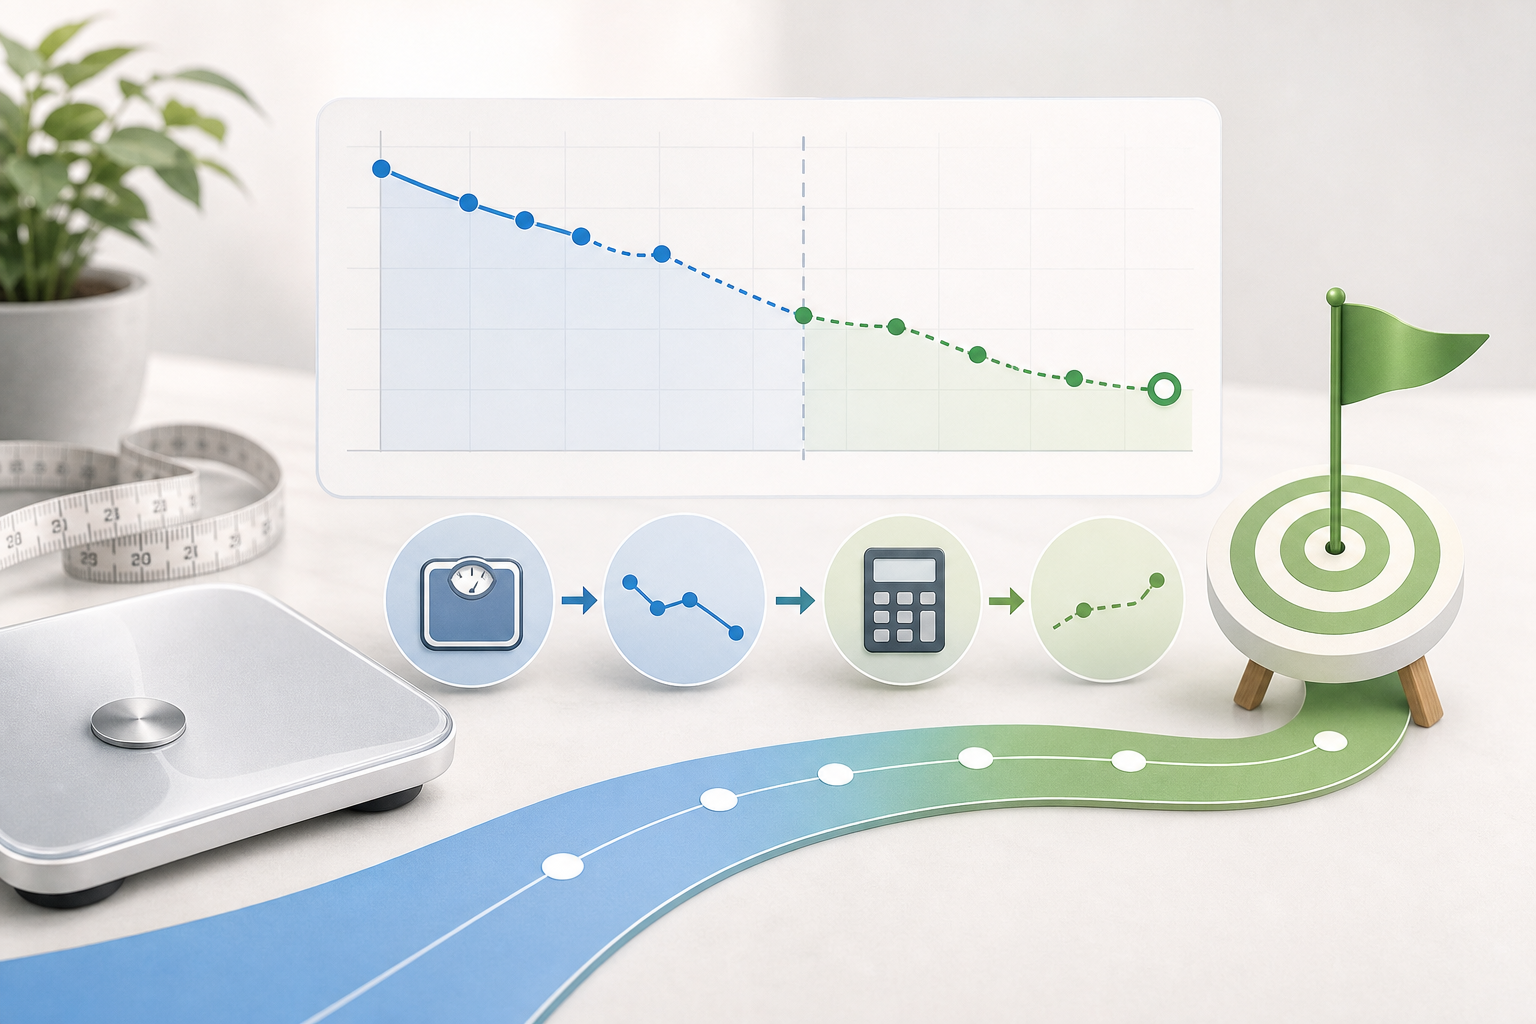
Understanding how a 4week weight trend projection is calculated starts with two weight measurements and the time between them. The change in weight is divided by the number of weeks to estimate an average weekly rate. That rate is then extended linearly for another four weeks. The result is a simple continuation of the observed trend, not a prediction of exactly what a person will weigh.
How a 4week weight trend projection is calculated
A four-week projection uses the difference between a starting weight and a current weight. It assumes that the average weekly weight trend observed between those measurements continues unchanged for four more weeks.
The calculation has two steps:
- Average weekly change = (current weight − starting weight) ÷ number of weeks
- Four-week projected weight = current weight + (average weekly change × 4)
A negative average indicates that weight decreased over the observed period. A positive average indicates an increase, while zero means there was no net change between the two measurements.
The weights must use the same unit. The calculation works in kilograms, pounds or another consistent weight unit. If the interval is recorded in days, it can be converted to weeks by dividing the number of days by seven.
Example of an average weekly weight trend
Suppose a person’s weight changed from 90 kg to 86 kg over eight weeks. First, calculate the total change:
86 kg − 90 kg = −4 kg
Next, divide the change by eight weeks:
−4 kg ÷ 8 = −0.5 kg per week
The observed average weekly weight trend is therefore −0.5 kg per week. Extending the same rate for another four weeks gives:
−0.5 kg × 4 = −2 kg
Adding that projected change to the current weight gives:
86 kg + (−2 kg) = 84 kg
The four-week weight trend projection is about 84 kg. This does not mean the person will necessarily weigh 84 kg in four weeks. It only shows where the previous average rate would lead if it continued without changing.
Why the projection is linear
A linear projection treats the average weekly change as a straight-line trend. If the observed rate is −0.5 kg per week, the calculation applies −0.5 kg to each future week. If the rate is +0.2 kg per week, it applies +0.2 kg to each week.
This method is intentionally simple. It does not attempt to model changes in energy needs, eating patterns, activity, body composition or other factors that may affect future weight. More detailed planning methods may use dynamic models rather than assuming that the same rate continues indefinitely. The NIDDK Body Weight Planner, for example, is designed around a more detailed body-weight model.
A four-week period keeps the extension relatively short, but it remains an estimate. The further a linear trend is extended, the less reasonable it may become to assume that the original weekly rate will remain constant.
How to interpret the projected number
The projected weight is best read as a trend-based planning estimate. It answers a narrow question: “If the average rate between these two measurements continued for four more weeks, what weight would that rate imply?”
It does not establish that the trend will continue. Individual measurements may also sit above or below the broader direction because body weight can vary between weigh-ins. Changes in measurement timing, clothing, food and fluid intake, and scale placement may affect the recorded value.
The starting and current measurements also have a strong influence on the result. If either measurement is unusual compared with surrounding readings, the calculated average may not represent the longer-term pattern well.
For example, consider two measurements taken only one week apart. A 1 kg difference would produce a rate of 1 kg per week, even if much of that difference were temporary. Using measurements that span a longer, consistently recorded interval may provide a more stable summary, although no interval removes uncertainty completely.
What the weight trend calculator can and cannot tell you
A weight trend calculator performs the arithmetic consistently. It uses the starting weight, current weight and elapsed time to calculate the average weekly change, then extends that rate for four weeks.
What it can estimate
- The total change between two weight measurements.
- The average amount of change per week over the selected interval.
- Whether the observed direction was downward, upward or unchanged.
- The weight implied by continuing the same average rate for four more weeks.
What it cannot determine
- Whether the same rate will actually continue.
- How much of the change reflects fat, muscle, fluid or other components.
- Whether either measurement was affected by temporary variation or measurement error.
- Whether a particular trend is appropriate for an individual’s health circumstances.
- The effects of future changes in food intake, physical activity, medication, illness or routine.
The result is calculated from the values entered; it is not a directly measured future weight. It should therefore be labelled and interpreted as a weight trend projection rather than a forecast with guaranteed accuracy.
Using the estimate more carefully
Consistent measurement conditions can make the input values easier to compare. This may include using the same scale, placing it on a similar surface and measuring at a similar time of day. Consistency does not eliminate normal variation, but it reduces avoidable differences in the measurement process.
It is also important to enter the actual time interval. If two measurements are 35 days apart, the interval is five weeks. Rounding the interval too heavily changes the calculated weekly rate and therefore changes the four-week projection.
Check that both weights use the same unit. A starting value in kilograms cannot be compared directly with a current value in pounds. One measurement must first be converted so that the units match.
Finally, avoid extending the result far beyond the stated four weeks. A rate observed over a limited period may change, and repeatedly applying it over many months can produce increasingly unrealistic figures. The calculation describes a mathematical continuation, not a fixed physiological path.
Frequently asked questions
What does a negative weekly trend mean?
A negative result means the current weight is lower than the starting weight. For example, −0.4 kg per week represents an average decrease of 0.4 kg per week over the observed interval. It does not mean that weight decreased by exactly that amount during every individual week.
What happens if the current and starting weights are the same?
The total change and average weekly change are both zero. The projected weight after four weeks will therefore equal the current weight. There may still have been changes between the two dates that are not visible from the two endpoint measurements.
Can the calculation show a projected weight gain?
Yes. If the current weight is higher than the starting weight, the average weekly change is positive. Extending that positive rate for four weeks produces a higher projected weight.
Does a four-week projection use compound change?
No. It adds the same absolute amount for each future week. For example, a trend of −0.5 kg per week produces a projected four-week change of −2 kg. It does not calculate a percentage-based compound rate.
Why might actual weight differ from the projection?
The observed rate may not continue, and individual weigh-ins can vary. Changes in routine, intake, activity, health circumstances or measurement conditions may also affect later results. The projection does not account for these future differences.
Is one pair of measurements enough to identify a long-term trend?
Two measurements are enough to calculate an average change between two points, but they provide limited information about what happened between them. Additional consistently collected measurements can show whether the apparent direction is sustained or largely reflects variation around the endpoints.
Putting the result in context
The key to understanding how a 4week weight trend projection is calculated is recognising its assumption: the observed average weekly rate is carried forward unchanged for four weeks. The arithmetic is straightforward, but the future value remains uncertain.
Used within that limit, the calculation offers a concise summary of direction and a simple planning estimate. It should not be interpreted as a measured future result or as a detailed model of how body weight changes over time.