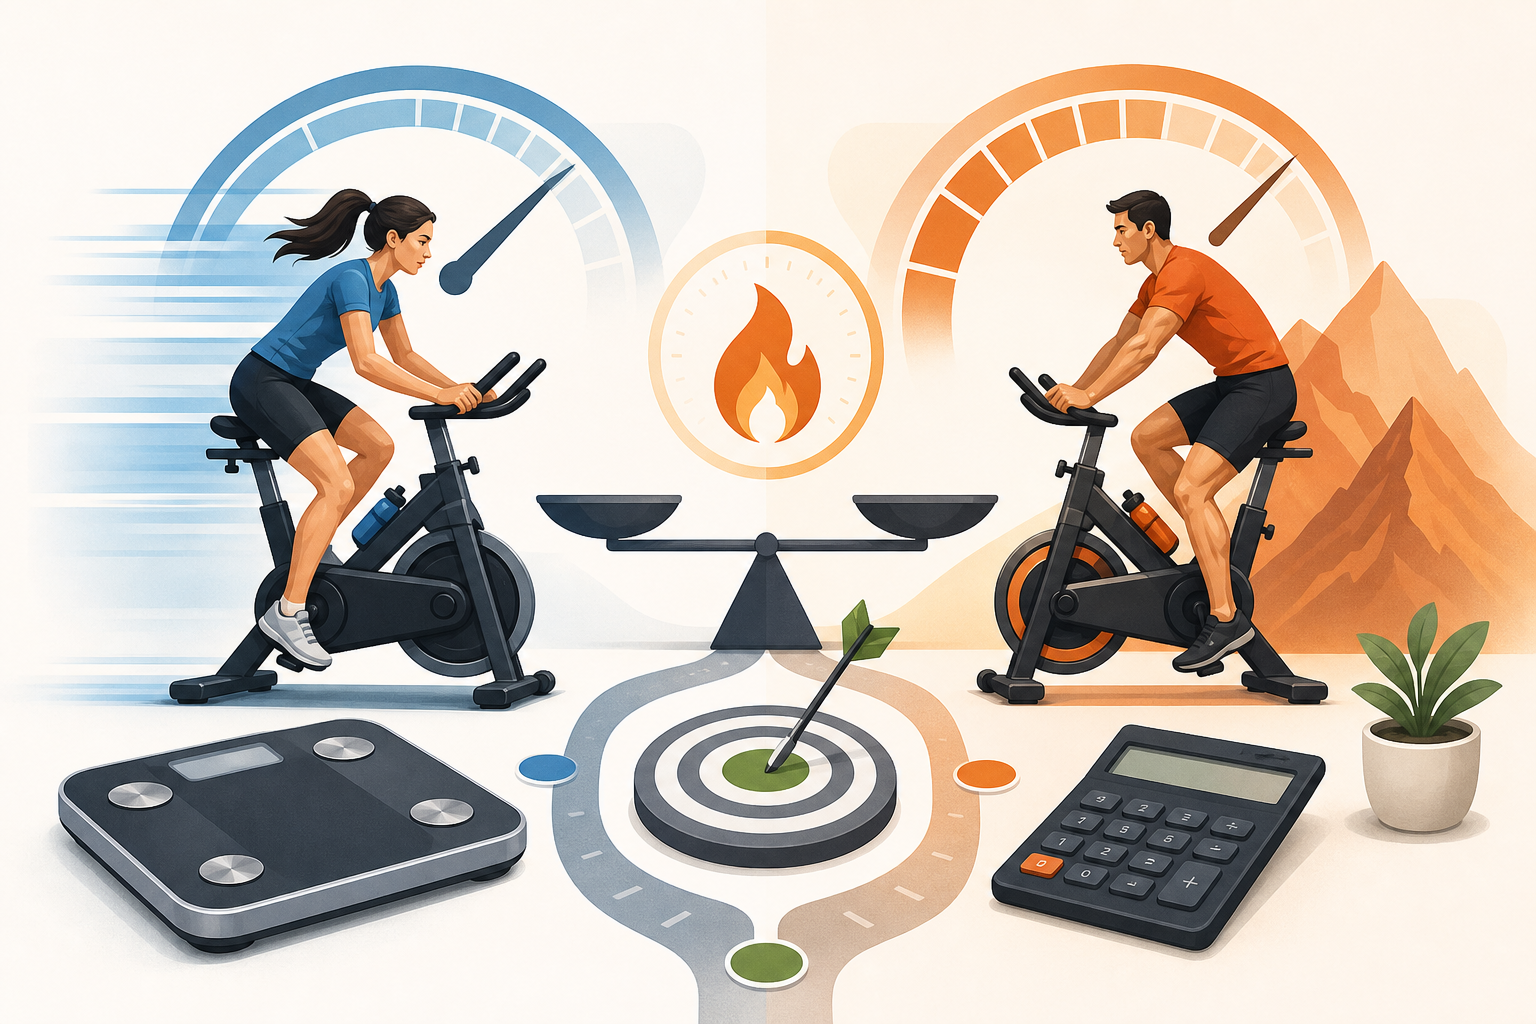
When comparing cycling speed vs resistance what affects calories burned more, resistance and the effort needed to overcome it are usually more informative than speed alone. A fast ride may require substantial energy, but speed can also come from a downhill slope, tailwind or low-resistance indoor setting. Calories burned cycling are better estimated from overall intensity, body weight and duration than from the speed displayed on a bike computer.
- Cycling speed vs resistance what affects calories burned more?
- Why the same cycling speed can have different energy costs
- How indoor and outdoor cycling differ
- Indoor cycling
- Outdoor cycling
- Intensity, duration and body weight in calorie estimates
- What a cycling calories calculator can and cannot tell you
- Practical ways to compare speed, resistance and effort
- Frequently asked questions
- Does cycling faster always burn more calories?
- Is higher resistance better than faster pedalling?
- Do hills increase calories burned cycling?
- Why does my stationary bike show a different calorie total from a calculator?
- Should coasting time be included in ride duration?
- Putting speed and resistance in context
Cycling speed vs resistance what affects calories burned more?
Resistance has the more direct relationship with workload. Increasing resistance means your muscles must apply more force to keep the pedals moving. Hills, headwinds, higher stationary-bike resistance and harder gearing can all increase the effort required at a given cadence.
Speed is an outcome of several factors rather than a consistent measure of effort. Outdoors, riding faster on level ground generally requires more work because the rider must overcome greater air resistance. However, the same speed may feel easy with a tailwind and demanding into a headwind.
On an indoor bike, displayed speed may be even less useful. One bike can report a high speed at modest resistance, while another uses a different calculation or calibration. A speed reading should therefore be interpreted alongside resistance, cadence, power or perceived effort.
Why the same cycling speed can have different energy costs
Two rides completed at the same average speed can produce very different bike calorie burn estimates. The following factors help explain why:
- Terrain: Climbing requires work against gravity, while descending may allow long periods of low-effort pedalling or coasting.
- Wind: A headwind increases resistance. A tailwind can help maintain speed with less effort.
- Bicycle and tyres: Bicycle type, riding position, tyre pressure and rolling surface can change the effort needed to travel at the same speed.
- Stops and coasting: An average speed may hide traffic stops, downhill coasting and repeated acceleration.
- Body weight: Weight influences standard calorie estimates and can have a particularly noticeable effect when climbing.
- Riding position: An upright position generally exposes more of the body to the air than a lower, more aerodynamic position.
Consider two cyclists moving at the same speed. One is riding on flat ground with a tailwind, while the other is climbing a gradual hill. Their speed is identical, but the cyclist climbing is working against greater resistance and will usually have the higher energy cost during that period.
The reverse can also happen. A cyclist may travel quickly downhill while using little muscular effort. Entering that downhill speed as though it represented sustained vigorous cycling could overstate the likely calorie expenditure.
How indoor and outdoor cycling differ
Indoor cycling
On a stationary bike, resistance is created by the machine rather than by wind, hills and road conditions. Raising the resistance while maintaining cadence increases the workload. Increasing cadence at the same resistance can also raise intensity because the rider is completing more pedal revolutions.
Resistance levels are not standardized across all indoor bikes. Level 8 on one model may not equal level 8 on another, and a bike’s speed or calorie display may be based on manufacturer-specific assumptions. Comparisons are most meaningful when using the same bike under similar settings.
If a bike reports power in watts, that value can provide a more direct indication of mechanical work than speed or a numbered resistance level. Calorie expenditure still has to be estimated because a power meter measures work delivered to the bicycle, not the body’s total energy use.
Outdoor cycling
Outdoor speed becomes more informative when conditions are known. On the same bicycle, route and weather conditions, a higher sustained speed generally reflects greater effort. Even then, changes in wind, surface, elevation and time spent drafting behind other riders can affect the relationship.
Average speed can also conceal variations within a ride. A hilly route may combine demanding climbs with fast descents, producing a moderate average speed despite substantial periods of hard work.
Intensity, duration and body weight in calorie estimates
Cycling calorie estimates commonly use metabolic equivalent of task, or MET, values. MET categories assign standardized intensity values to activities, including cycling at different effort levels. The 2024 Adult Compendium of Physical Activities is an authoritative source for these activity classifications.
A common estimation method is:
Estimated kcal = MET × 3.5 × body weight (kg) ÷ 200 × minutes
This formula shows why no single cycling speed produces the same calorie estimate for everyone. The result changes with the selected intensity, the rider’s body weight and the duration of the session.
For example, an 80 kg person cycling for 45 minutes at an estimated intensity of 6.8 MET would have an estimated expenditure of about 428 kcal:
6.8 × 3.5 × 80 ÷ 200 × 45 = approximately 428 kcal
This is an estimate rather than a measurement. The chosen MET level represents a category of activity and cannot capture every difference in bicycle setup, terrain, fitness, riding technique or environmental conditions.
Duration also matters. A shorter high-intensity ride may use energy at a faster rate, while a longer moderate ride may have a larger total because the activity continues for more time. Comparing calories per minute and total calories can therefore lead to different conclusions.
What a cycling calories calculator can and cannot tell you
A cycling calories calculator estimates energy expenditure from body weight, cycling intensity and duration. It is useful when you know the general effort category but do not have individualized laboratory measurements.
The calculator can help you:
- Estimate calories for rides of different durations.
- Compare broad intensity categories.
- See how body weight affects a standard MET-based estimate.
- Use a consistent method when planning or reviewing similar cycling sessions.
It cannot determine your exact energy expenditure from speed alone. It also cannot fully account for:
- Changes in hills, wind and road surface during a ride.
- Time spent coasting, drafting or waiting at junctions.
- Differences between stationary-bike resistance systems.
- Individual differences in efficiency and riding technique.
- Calibration errors in bike displays, fitness trackers or power meters.
Select the intensity that best reflects the ride as a whole rather than relying only on the highest speed reached. If a session varied greatly, estimating easier and harder portions separately may describe it better than applying one intensity to the entire ride.
Power-meter data may support a more individualized estimate because it reflects mechanical work, but conversion from power to calories still involves assumptions. Calculator results and device readings should both be treated as estimates.
Practical ways to compare speed, resistance and effort
For indoor sessions, keep the bike and setup consistent when comparing rides. Record duration, resistance, cadence and, when available, average power. Speed alone may not show whether one session required more work.
For outdoor rides, compare similar routes under similar conditions. A slower ride into a strong headwind may be more demanding than a faster ride in calm weather, while elevation gain can explain why a low average speed still involved substantial effort.
Perceived effort can add useful context. Note whether the ride felt easy, moderate or hard and whether that effort was sustained or limited to short intervals. This does not directly measure calories, but it can help you choose a more appropriate intensity category.
A practical comparison might look like this:
- Ride A: 30 minutes at high indoor resistance with a steady cadence and moderate displayed speed.
- Ride B: 30 minutes at low resistance with a faster displayed speed.
Ride A may require more energy even though its reported speed is lower. If the bike provides reliable power data, average power would be more useful for comparing the mechanical workload of the two sessions.
Frequently asked questions
Does cycling faster always burn more calories?
No. Faster cycling often requires more energy on level ground, but speed can be increased by a tailwind, downhill slope or low-resistance indoor setting. Intensity and duration provide better context than speed by itself.
Is higher resistance better than faster pedalling?
Both resistance and cadence contribute to workload. High resistance at a very low cadence and low resistance at a rapid cadence can each be demanding. Power, when measured reliably, reflects the combined effect more directly.
Do hills increase calories burned cycling?
Climbing generally raises the effort required because the cyclist must work against gravity. However, the total estimate for a hilly ride also depends on climb duration, gradient, body weight and how much time is spent descending or coasting.
Why does my stationary bike show a different calorie total from a calculator?
The bike and calculator may use different equations, intensity assumptions or personal information. Some bikes estimate calories from speed and resistance, while others may use power or heart-rate data. Neither value should automatically be considered exact.
Should coasting time be included in ride duration?
It depends on the purpose of the estimate. For a general estimate of the complete outing, total elapsed or moving time may be acceptable. For a closer estimate of active cycling, separate substantial periods of coasting or rest where practical.
Putting speed and resistance in context
The practical answer to cycling speed vs resistance what affects calories burned more is that resistance and total workload usually matter more than speed alone. Outdoor speed can indicate higher intensity when route and weather conditions are comparable, but it is not a universal measure of effort.
For a useful estimate, consider intensity, duration and body weight together. Add context from hills, wind, resistance, cadence and power where available, and interpret any bike calorie burn result as an estimate rather than a measured value.