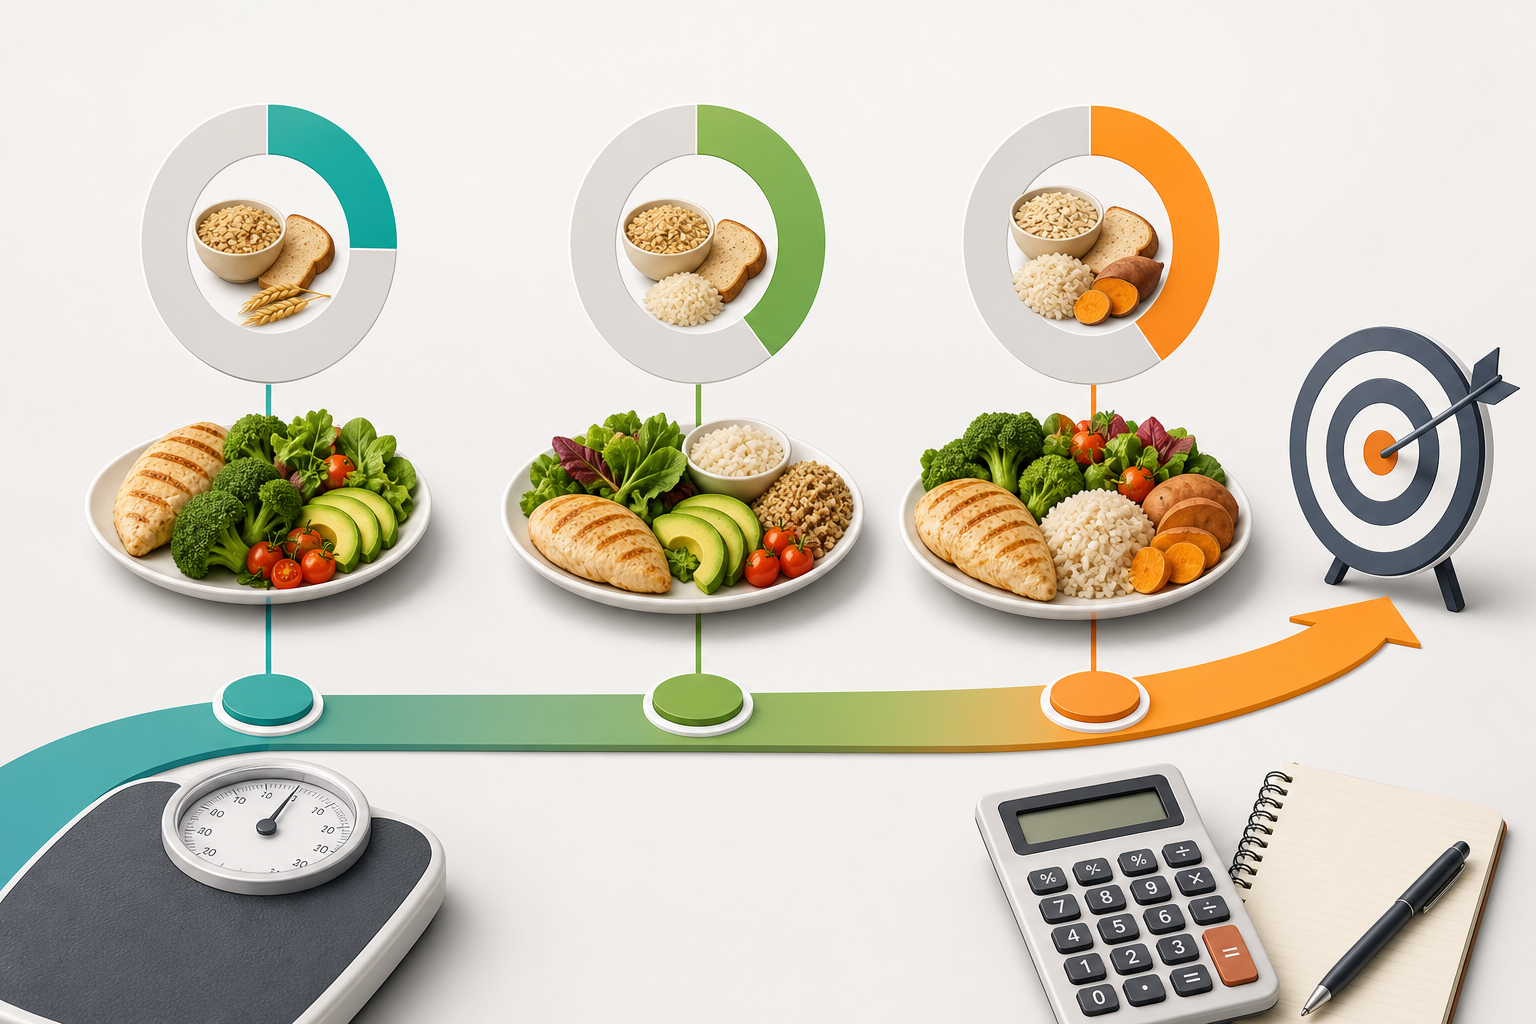
The comparison 20 vs 30 vs 40 carbs how macro grams change is based on a simple rule: when daily calories stay fixed, a higher carbohydrate percentage produces more carbohydrate grams. In this planning model, protein remains at 30% of calories, so fat decreases as carbohydrate increases. At 2,000 kcal, the three options provide 100 g, 150 g or 200 g of carbohydrate respectively.
These percentages describe each macronutrient’s share of total energy, not its share of food weight or plate volume. Because carbohydrate and fat provide different amounts of energy per gram, adding 50 g of carbohydrate does not mean subtracting 50 g of fat.
20 vs 30 vs 40 carbs how macro grams change at the same calories
The low-carbohydrate planning model used here fixes protein at 30% of daily calories. Carbohydrate is set at the selected percentage, and fat receives the remaining calories.
| Carbohydrate setting | Protein share | Fat share |
|---|---|---|
| 20% carbohydrate | 30% | 50% |
| 30% carbohydrate | 30% | 40% |
| 40% carbohydrate | 30% | 30% |
Moving from 20% to 30% carbohydrate transfers 10% of total calories from fat to carbohydrate. Moving from 30% to 40% does the same again. Protein grams do not change because the protein percentage is fixed.
At any calorie level, each 10-percentage-point increase adds 25 g of carbohydrate per 1,000 kcal. It removes about 11.1 g of fat per 1,000 kcal because carbohydrate provides about 4 kcal per gram, while fat provides about 9 kcal per gram.
How carbohydrate, protein and fat grams are calculated
Macro percentages must first be converted into calories and then into grams. Standard energy conversion factors assign approximately 4 kcal per gram to carbohydrate and protein and 9 kcal per gram to fat. These are planning conversions, so displayed gram values may be rounded.
- Protein grams: daily calories × 30% ÷ 4
- Carbohydrate grams: daily calories × selected carbohydrate percentage ÷ 4
- Fat percentage: 100% − 30% protein − carbohydrate percentage
- Fat grams: daily calories × fat percentage ÷ 9
For example, with 2,000 kcal and 30% carbohydrate:
- Protein: 2,000 × 0.30 ÷ 4 = 150 g
- Carbohydrate: 2,000 × 0.30 ÷ 4 = 150 g
- Fat percentage: 100% − 30% − 30% = 40%
- Fat: 2,000 × 0.40 ÷ 9 = about 88.9 g
Rounding the fat result to 89 g is practical, but it creates a small difference between the displayed grams and the exact calorie total. This is normal when macro targets are presented as whole grams.
Examples at 1,600 and 2,000 kcal
The same carb percentage produces different gram targets at different calorie levels. The tables below show the direct comparison while keeping calories and the 30% protein share fixed.
At 1,600 kcal per day
| Carbohydrate share | Protein | Carbohydrate | Fat |
|---|---|---|---|
| 20% | 120 g | 80 g | About 88.9 g |
| 30% | 120 g | 120 g | About 71.1 g |
| 40% | 120 g | 160 g | About 53.3 g |
At 2,000 kcal per day
| Carbohydrate share | Protein | Carbohydrate | Fat |
|---|---|---|---|
| 20% | 150 g | 100 g | About 111.1 g |
| 30% | 150 g | 150 g | About 88.9 g |
| 40% | 150 g | 200 g | About 66.7 g |
At 2,000 kcal, every 10-percentage-point rise in carbohydrate adds 50 g of carbohydrate and removes about 22.2 g of fat. Protein stays at 150 g in all three patterns.
The fat change is smaller in grams because each gram of fat contains more energy than each gram of carbohydrate. The calorie transfer is equal even though the gram changes are not.
Using the percentages in a practical planning scenario
Consider someone using a 2,000 kcal planning estimate who wants to compare three sets of low carb macros. At 20% carbohydrate, the target is 100 g of carbohydrate, 150 g of protein and about 111 g of fat. This is the lowest-carbohydrate and highest-fat option in the comparison.
At 30% carbohydrate, the target becomes 150 g of carbohydrate, 150 g of protein and about 89 g of fat. Daily calories and protein remain unchanged, but 200 kcal have shifted from fat to carbohydrate compared with the 20% pattern.
At 40% carbohydrate, the target is 200 g of carbohydrate, 150 g of protein and about 67 g of fat. Compared with the 20% option, carbohydrate has increased by 100 g and fat has decreased by about 44 g. Total planned energy is still approximately 2,000 kcal.
No single carb percentage is automatically appropriate for everyone. A percentage is a way to organise an energy target; it does not account for food preferences, training demands, digestive tolerance, health conditions or the nutritional quality of the foods selected.
It is also useful to separate the percentage from the calorie target. If calories change, all gram targets change even when the percentages remain identical. For example, 30% carbohydrate equals 120 g at 1,600 kcal but 150 g at 2,000 kcal.
What the low carb macro calculator can and cannot tell you
The low carb macro calculator converts a daily calorie value into estimated macro gram targets. It uses 30% of calories for protein, applies the selected carb percentage and assigns the remaining energy to fat.
The calculator can show:
- Estimated daily grams of protein, carbohydrate and fat
- How the fat target changes when the carb percentage changes
- Whether the three macro percentages add up to 100% of planned calories
- A consistent comparison between different carbohydrate settings
The calculator cannot determine:
- Whether the calorie input reflects an individual’s measured energy use
- Whether a particular macro split is medically suitable
- The quality, variety or micronutrient content of the foods chosen
- How much fibre, added sugar or saturated fat the eating pattern contains
- How an individual will feel or perform with a particular split
The results are planning estimates rather than measured nutritional needs. The calorie value entered may itself be an estimate, and real food labels, serving sizes and tracking records also involve rounding.
Frequently asked questions
Does 20% carbohydrate mean that 20% of my food should be carbohydrate?
No. It means that 20% of planned calories come from carbohydrate. It does not mean that carbohydrates should occupy 20% of a plate or make up 20% of food by weight.
Why does protein stay the same in every example?
This specific calculator model fixes protein at 30% of calories. Only the carbohydrate percentage is selected, while fat fills the remaining percentage. A different macro model could use a different protein share and therefore produce different gram targets.
Why do fat grams fall by less than carbohydrate grams rise?
Fat provides approximately 9 kcal per gram, compared with approximately 4 kcal per gram for carbohydrate. Replacing 200 kcal from fat with 200 kcal from carbohydrate therefore removes about 22.2 g of fat while adding 50 g of carbohydrate.
Is 40% carbohydrate still low carb?
Low-carbohydrate eating patterns are defined in different ways, so the label is not always applied consistently. In this calculator, 40% is simply one selectable carb percentage within a lower-carbohydrate planning framework. The gram amount still depends on total calories.
Do rounded macro grams always reproduce the exact calorie target?
Not always. Whole-gram rounding can create a small difference when the grams are converted back into calories. Values such as 88.9 g of fat may be displayed or tracked as 89 g, so the total is an approximation.
What happens if daily calories change but the carb percentage does not?
Protein, carbohydrate and fat grams all change in proportion to the calorie target. A 30% carbohydrate share gives 30% of calories from carbohydrate at any intake, but the number of grams rises or falls with total calories.
In summary, 20 vs 30 vs 40 carbs how macro grams change depends on both the selected percentage and daily calories. With calories fixed, increasing carbohydrate raises carbohydrate grams, leaves protein unchanged in this model and lowers fat grams by the corresponding amount of energy.