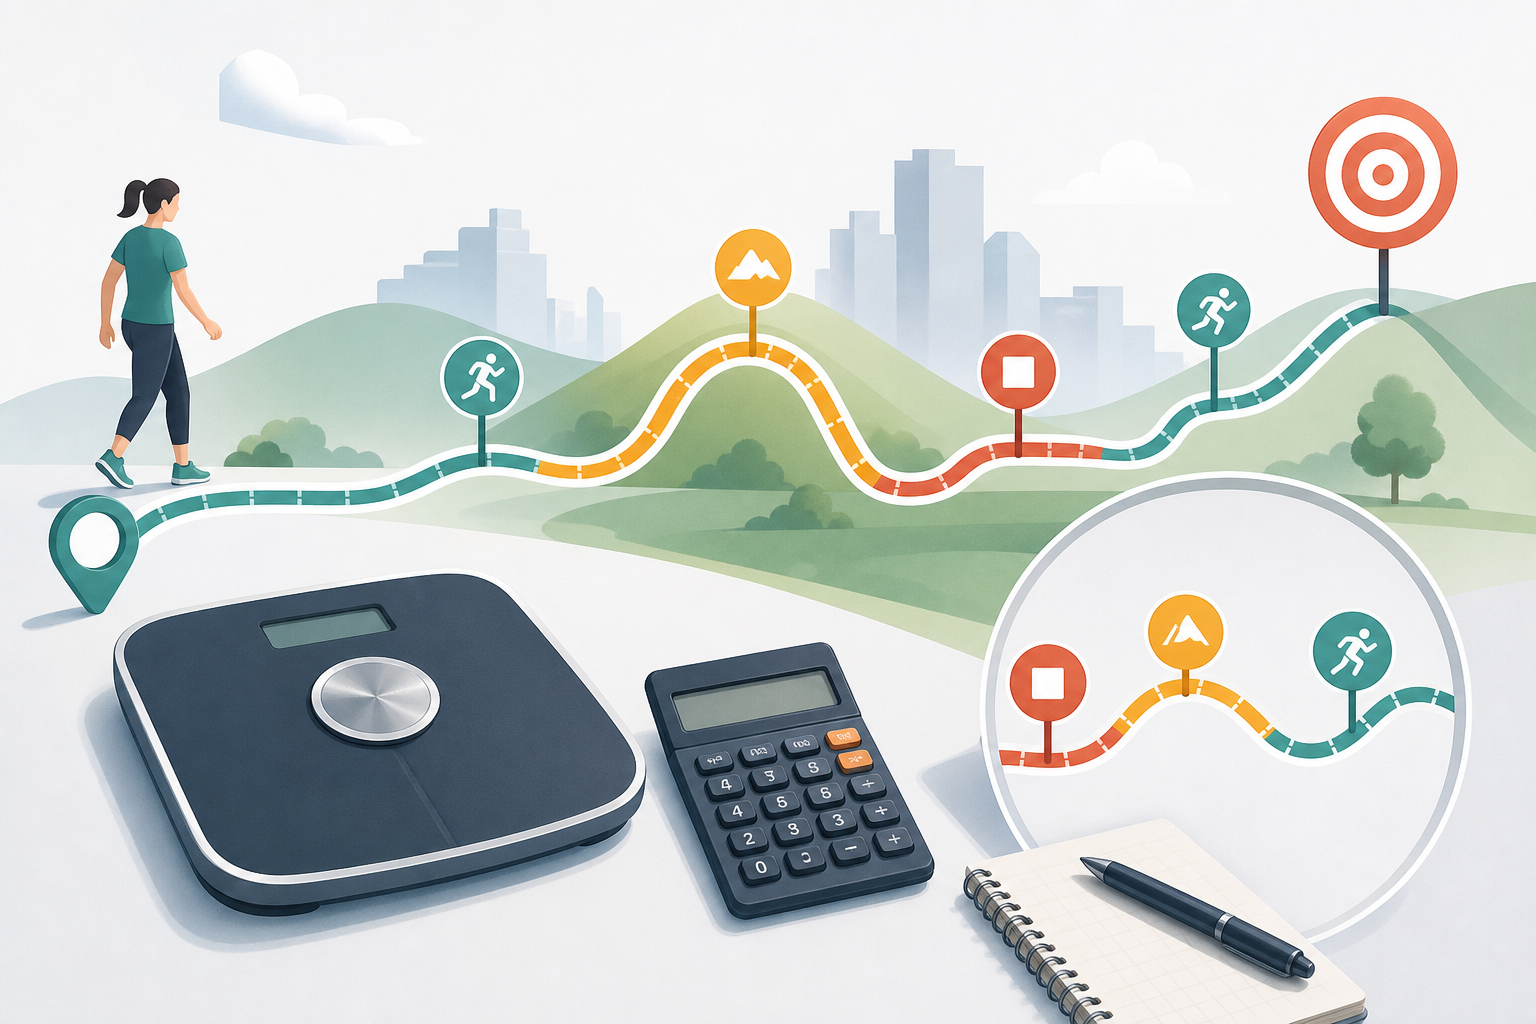
Understanding why average pace can hide stops hills and speed changes starts with how the number is calculated: total time is divided by total distance. This produces one useful summary, but it does not show when you paused, slowed on a climb, accelerated downhill or changed speed throughout a walk or run. Two sessions can therefore have the same average pace while following very different patterns.
Why average pace can hide stops hills and speed changes
Pace expresses how much time it takes to cover one kilometre or one mile. The basic formula is:
Pace = elapsed time ÷ distance
Average speed reverses the calculation:
Average speed = distance ÷ elapsed time
For example, covering 5 kilometres in 30 minutes gives an average pace of 6:00 minutes per kilometre and an average speed of 10 kilometres per hour.
These calculations combine the entire session into one value. They do not preserve the sequence of events within it. A steady 30-minute effort and an interval session containing fast sections, slow recoveries and pauses may produce the same result.
The word “average” is therefore important. The result describes the relationship between total distance and total time, not the pace maintained at every moment.
How stops, hills and changing speed affect the result
Stops may be included or excluded
If elapsed time includes traffic lights, water breaks, route checks or rest periods, those stops make the calculated pace slower. The clock continues while no additional distance is covered.
Some watches and tracking apps also report moving time. A moving-time pace excludes periods that the device identifies as stationary, while an elapsed-time pace includes the complete duration from start to finish. These figures answer different questions.
- Elapsed-time pace describes the overall time required to complete the distance.
- Moving-time pace estimates pace only while the device considers you to be moving.
Automatic pause settings can add another difference. Devices may use different movement thresholds, so a very slow walking pace might be treated as movement by one device and as a pause by another.
Hills can cancel each other out in the average
An uphill section often takes longer than a similar flat section, while a downhill section may be completed more quickly. Once the times are combined, the slower climb and faster descent can produce an ordinary-looking average.
Average pace does not identify elevation gain, gradient, surface or direction of travel. It also cannot show whether the same pace was achieved on level ground or on a route with repeated climbs.
This matters when interpreting effort. The 2024 Adult Compendium of Physical Activities distinguishes between activities performed at different speeds and grades, which illustrates that pace is only one characteristic of walking or running activity.
Fast and slow sections become one number
Speed changes may be deliberate, such as intervals, run-walk periods or a progressive run. They may also result from congestion, crossings, weather, fatigue or uneven terrain.
Suppose half of a route is completed faster than usual and the other half more slowly. The final average falls somewhere between the two, but it does not reveal the size, duration or timing of either change.
Because pace is time per unit of distance, it should not be averaged casually from separate pace values when the segment distances differ. Adding the segment times and dividing by the total distance gives the correct overall pace.
A practical example: the same average, a different experience
Consider a 6-kilometre session with a mixture of steady movement, a hill, a stop and a faster downhill section:
| Part of session | Distance | Time | What happened |
|---|---|---|---|
| Opening section | 2 km | 12 minutes | Steady pace |
| Uphill section | 1 km | 8 minutes | Speed decreased on the climb |
| Stop | 0 km | 4 minutes | Traffic or rest break |
| Downhill section | 1 km | 5 minutes | Speed increased |
| Final section | 2 km | 13 minutes | Moderate pace |
The total elapsed time is 42 minutes for 6 kilometres. The elapsed-time average is therefore 7:00 min/km.
If the four-minute stop is excluded, moving time is 38 minutes. The moving average becomes approximately 6:20 min/km.
Neither figure is wrong. The 7:00 pace describes the full start-to-finish session, while the 6:20 pace describes movement after removing the recorded stop. However, neither number shows the 8-minute climb, the 5-minute descent or the order in which the changes occurred.
Another person could cover the same 6 kilometres steadily in 42 minutes and also record 7:00 min/km. The matching averages would not mean the two sessions had the same terrain, pacing pattern or interruption time.
What a pace calculator can and cannot tell you
A pace calculator calculates pace and average speed from distance and elapsed time. It is useful when converting a completed session into min/km, min/mile or a corresponding speed.
To use it, select the requested units, enter the distance and time, and calculate the result. Make sure the time entered matches the question you want to answer.
- Use elapsed time to assess the complete time from starting to finishing.
- Use moving time to estimate the average while in motion.
- Keep the same time definition when comparing sessions.
- Check whether the distance is measured in kilometres or miles.
A pace calculator can tell you:
- Average running pace or walking pace over the entered distance
- Average speed for the entered distance and time
- How two totals compare when the same method and units are used
- A simple target time based on a chosen average pace
It cannot tell you:
- Where stops occurred or why they happened
- How much the pace changed within the session
- Whether the route was flat, uphill, downhill or mixed
- Whether the surface, weather or congestion affected movement
- How consistently the pace was maintained
- How demanding the session felt to the individual
The result is a calculated average, not a direct measurement of every moment. Its usefulness depends on the accuracy of the distance and time entered.
How to read pace alongside the full session
Average pace becomes more informative when it is considered with other available details. You do not need every possible metric; choose information that helps answer the specific question.
Review splits
Splits show the time or pace for smaller sections, such as each kilometre or mile. They can reveal a fast start, a slower climb, a late acceleration or repeated changes that disappear from the overall average.
Compare elapsed time with moving time
The gap between these values provides an estimate of excluded stationary time, although device detection may not be exact. A large difference suggests that the overall result was affected by stops.
Consider elevation and route conditions
An elevation profile can show where climbs and descents occurred. Notes about surface, crossings or congestion can also explain why two sessions on different routes have unequal pace despite similar duration or effort.
Use comparable data
Comparisons are clearer when distance measurement, unit system, pause settings and time definitions remain consistent. A moving-time pace from one session should not be treated as directly equivalent to an elapsed-time pace from another.
GPS distance is also an estimate and may vary with signal quality, route shape and device processing. Small differences in recorded distance can change the calculated pace even when the actual outing was similar.
Frequently asked questions
Is average pace the pace I maintained for the whole route?
Not necessarily. It is the total time divided by total distance. You may have moved faster or slower than the average for much of the route and matched the average only as a final calculation.
Should I enter elapsed time or moving time in a pace calculator?
Use elapsed time if you want the complete start-to-finish result, including stops. Use moving time if you want an estimate based only on periods recorded as movement. Label or remember which definition you used.
Can two people have the same average pace but different splits?
Yes. One person might move steadily, while another alternates between fast and slow sections. If their total times and distances match, their average pace will also match.
Why does my walking pace change on the same route?
Stops, route congestion, surface conditions, hills and differences in recorded distance can all affect the result. Looking at splits and elapsed versus moving time may help identify where the difference occurred.
Does a faster average pace always mean a better session?
No. A faster figure only indicates less average time per unit of distance. It does not, by itself, describe the route, purpose, pacing strategy or individual experience of the session.
The central reason why average pace can hide stops hills and speed changes is that it compresses all distance and time into one summary. Use that summary for planning and broad comparison, but use splits, time definitions and route context when the pattern of the walk or run matters.