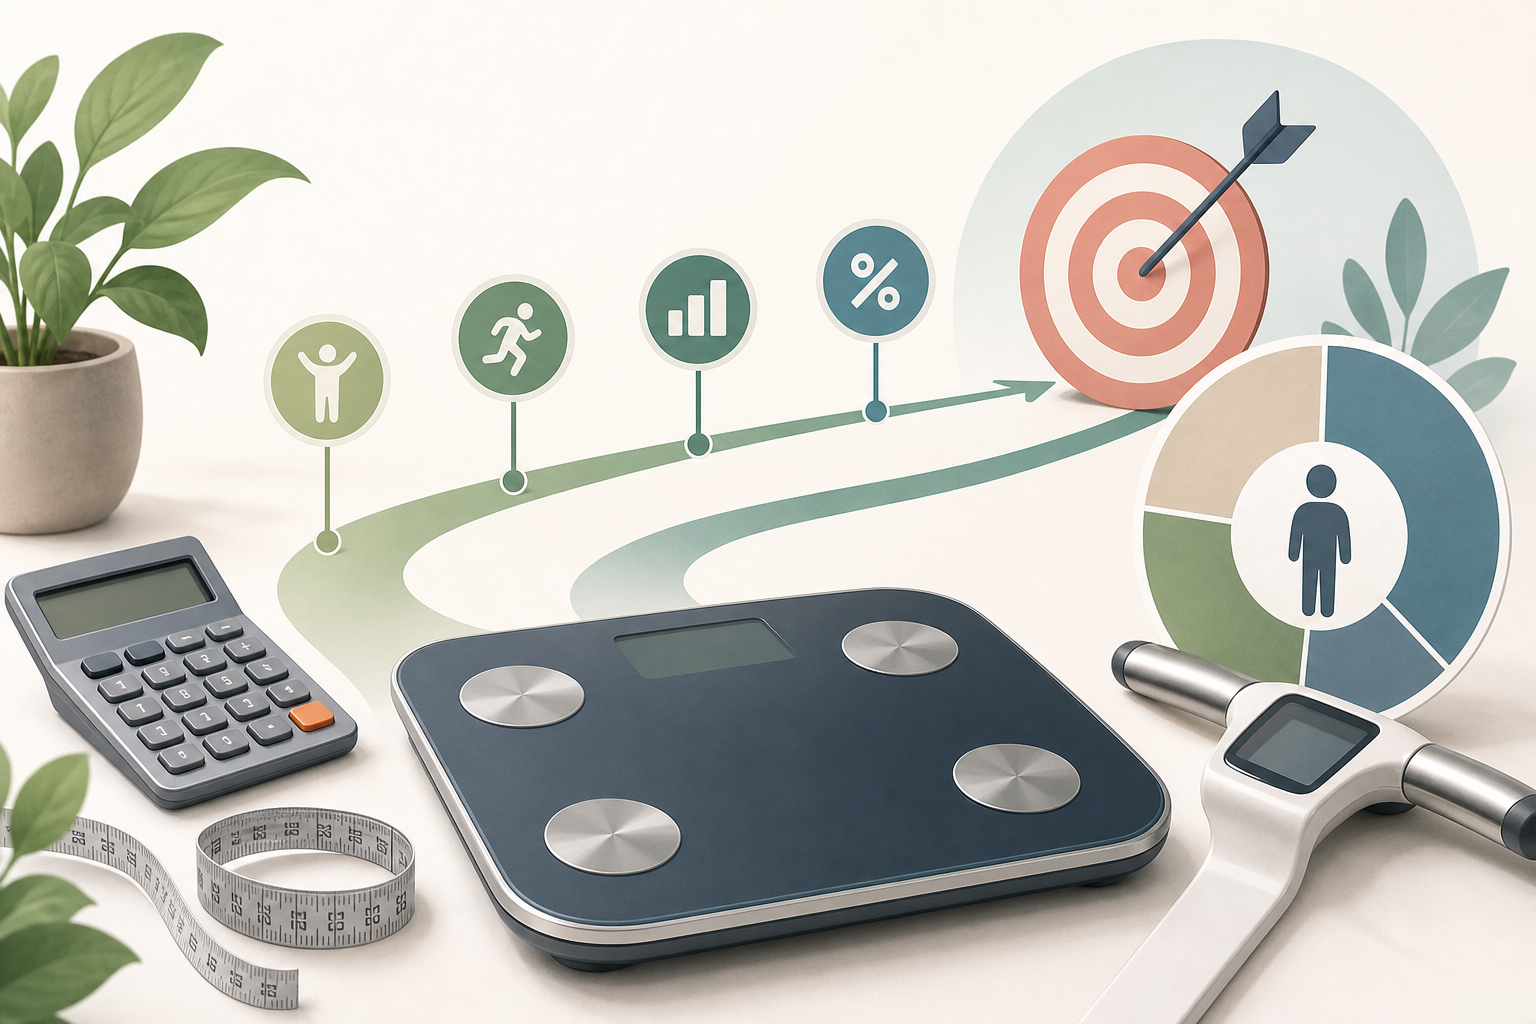
Tracking body fat percentage and weight loss can provide more context than scale weight alone. Body weight includes fat, muscle, body water, bone, organs and other tissues, so the number on the scale may change differently from an estimate of body composition. Looking at both measures as trends can help you interpret progress without treating either result as exact.
Why body fat percentage and weight loss can change differently
Body-fat percentage is the estimated proportion of your total weight that consists of fat mass. The remaining portion is commonly described as fat-free mass, which includes muscle, water, bone, organs and other non-fat tissues.
Because body weight combines all these components, a lower scale reading does not show what type of tissue changed. Weight may decrease while estimated body-fat percentage changes only slightly. In another situation, weight may remain stable while the estimated percentage falls.
Short-term scale changes often reflect differences in body water, food and drink in the digestive system, and measurement conditions. These changes can temporarily hide a gradual change in fat mass. Circumference-based body-fat estimates also fluctuate when tape placement, posture or abdominal tension varies.
How to interpret weight and body-composition trends
No single pattern proves exactly what has happened inside the body. However, comparing scale weight, circumference measurements and estimated body-fat percentage can suggest possible explanations.
| Observed trend | Possible interpretation | Important caution |
|---|---|---|
| Weight decreases and estimated body-fat percentage decreases | Fat mass may be decreasing. | The size of the change remains an estimate and may include changes in body water or fat-free mass. |
| Weight decreases but estimated body-fat percentage is similar | Fat and fat-free mass may both have changed, or the difference may be too small for the method to detect clearly. | Measurement variability can obscure modest changes. |
| Weight is stable but estimated body-fat percentage decreases | Fat mass may have decreased while fat-free mass or body water increased. | A small difference may result from tape placement rather than a true body-composition change. |
| Weight increases while estimated body-fat percentage is stable or lower | Fat-free mass, body water, fat mass or a combination may have increased. | The measurements cannot identify the exact tissue responsible. |
| Weight and estimated body-fat percentage rise | Fat mass may have increased. | Confirm the pattern with repeated, consistently taken measurements. |
Percentage changes also depend on the denominator: total body weight. For example, an estimated 24 kilograms of fat at a body weight of 80 kilograms equals 30% body fat. If both fat mass and total weight change, the new percentage reflects the relationship between those two values rather than fat loss alone.
A practical body-composition example
Consider a person whose initial measurements produce an estimated body-fat percentage of 30% at 80 kilograms. That result corresponds to an estimated 24 kilograms of fat mass and 56 kilograms of fat-free mass.
Later, the person weighs 78 kilograms and receives an estimated result of 28%. The calculation would indicate approximately 21.8 kilograms of fat mass and 56.2 kilograms of fat-free mass. If both estimates were accurate, this pattern would be consistent with lower fat mass and broadly stable fat-free mass.
However, circumference methods do not measure those compartments directly. A slightly different waist or neck measurement can change the percentage and the derived fat-mass figures. The sensible interpretation is that the combined trend may indicate a body-composition change, not that the calculated difference is exact to a fraction of a kilogram.
A different person might remain at the same scale weight while their waist circumference gradually becomes smaller. If repeated estimates also trend lower under similar measuring conditions, the combined information may be more useful than the unchanged scale reading alone.
How to track trends more consistently
Consistency cannot remove every source of error, but it can make comparisons more meaningful. The aim is to reduce differences caused by technique and daily conditions.
- Use the same scale and measuring tape when possible.
- Measure under similar conditions, such as at a comparable time of day.
- Place the tape at the locations specified by the calculation method.
- Keep the tape level and snug without compressing the skin.
- Use a relaxed, repeatable posture rather than pulling in the abdomen.
- Record the underlying circumferences as well as the calculated percentage.
- Compare a series of readings rather than relying on one isolated result.
If a result changes unexpectedly, repeat the measurement before drawing a conclusion. A sudden shift in estimated body fat without a similar change in scale weight or circumferences may reflect measurement variation.
It is also useful to keep units consistent. Switching between centimetres and inches is acceptable when a calculator converts them correctly, but recording measurements in one unit reduces transcription and conversion mistakes.
What the body fat calculator can and cannot tell you
The body fat calculator estimates body-fat percentage using the U.S. Navy circumference method. This approach applies sex-specific logarithmic equations based on height and neck and waist measurements; the female equation also includes hip circumference. When body weight is supplied, the tool can also estimate fat mass and fat-free mass.
What it can tell you
- An estimated body-fat percentage based on the measurements entered.
- Approximate fat mass and fat-free mass when weight is available.
- Whether repeated results appear to be moving upward, downward or remaining broadly stable.
- A convenient way to monitor measurements without specialised equipment.
What it cannot tell you
- Your directly measured body-fat percentage.
- Whether a small change is genuine or caused by tape-placement variation.
- Exactly how much muscle, water, bone or other tissue has changed.
- Where fat is stored or how it is distributed throughout the body.
- The cause of an unexpected weight or circumference change.
- A result equivalent to DXA or another clinical body-composition assessment.
The calculation is only as reliable as the measurements entered. It is better suited to observing broad trends under consistent conditions than to detecting very small changes. Results from different body-composition methods may also disagree because they use different assumptions and measurement techniques.
Using more than one measure of progress
Scale weight and body-fat percentage each answer a limited question. Scale weight describes total mass at that moment, while a circumference equation estimates how much of that total may be fat. Neither gives a complete account of health, physical function or changes in individual tissues.
A broader record may include weight trends, waist and other circumferences, clothing fit, physical performance and consistently measured body-fat estimates. Not every measure will move in the same direction at the same time.
A clinical body-composition assessment may be useful when greater measurement precision is important, but even specialised methods have protocols and limitations. Comparisons are generally easier to interpret when the same method is used repeatedly rather than switching among unrelated devices and equations.
Frequently asked questions
Can body-fat percentage decrease without losing weight?
It can. If fat mass decreases while fat-free mass or body water increases by a similar amount, scale weight may remain stable. A circumference-based estimate can suggest this pattern, but it cannot confirm the exact tissues involved.
Why did my weight fall while my estimated body-fat percentage increased?
The result may reflect a change in fat-free mass, body water or measuring technique. Because body-fat percentage is a proportion of total weight, it can rise if total weight falls without a comparable estimated reduction in fat mass. Repeating the measurements consistently can help determine whether the result is part of a trend.
How often should I use a body fat calculator?
There is no single schedule that suits everyone. Body-composition estimates are usually more informative when there is enough time to observe a trend and when measurements are taken under comparable conditions. Measuring very frequently may highlight normal variation rather than a meaningful change.
Is circumference-based body-fat percentage accurate?
It is an estimate based on the relationship between selected body circumferences and body composition. It is convenient and repeatable when technique is consistent, but tape placement and individual body shape can affect the result. It should not be treated as equivalent to a direct or clinical measurement.
Should I focus on kilograms lost or body-fat percentage?
The more useful measure depends on what you are trying to understand. Scale weight is straightforward but does not identify the type of mass that changed. Estimated body-fat percentage adds context, while circumferences and other consistently recorded measures can provide further information.
Putting the results in perspective
The clearest way to assess body fat percentage and weight loss is to look for sustained patterns across several consistently collected measurements. Scale weight may move before circumference estimates do, remain stable while body composition appears to change, or fluctuate temporarily for reasons unrelated to fat mass.
Treat calculated percentages and derived fat-mass values as estimates rather than precise measurements. When weight, circumferences and estimated body composition point in a similar direction over time, the overall trend is generally more informative than any single reading.